The Ankota Financial Management Services (FMS) App for Self-Directing Clients
Overview
For clients, family members, and representatives, managing home care can be overwhelming. Self-direction gives the freedom to choose caregivers and control services, but it comes with the complex administrative burdens of payroll, billing, and compliance.
The Ankota Financial Management Services (FMS) Mobile App provides a transparent, secure, and user-friendly way to oversee home services from a single application.
Primarily this is an app, but a browser-based option is also available at: https://fms.ankota.net/
Key capabilities:
- Secure Access: Straightforward login with biometric authentication for subsequent visits.
- At-a-Glance Progress Bars: See how much of the budget or hours have been used with color-coded bars.
- Flexible Tracking: Display services by hours/units for direct care or by monetary budget.
- Visit Verification: Review and verify provider visit times and tasks performed.
- Easy Expense Submission: Add a new expense and attach a receipt or invoice for reimbursement.
Login
The journey with the Ankota FMS App begins with a straightforward login process.
- Enter Your Credentials: Enter the username and password provided by the organization.
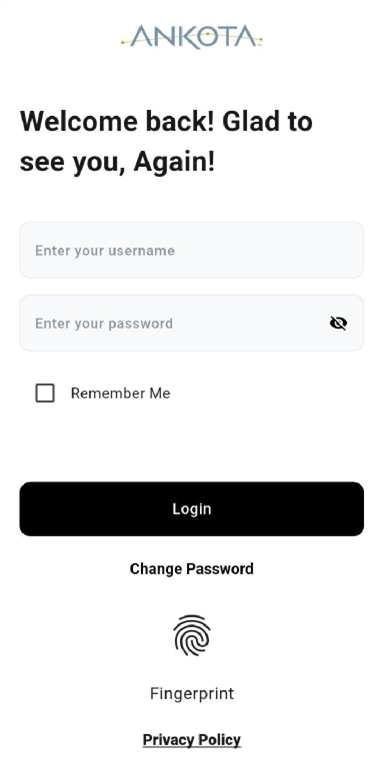
- Biometric Login: Once "Remember Me" is enabled, the app offers biometric authentication for quick, secure logins on subsequent visits.
- Change Password: A "Change Password" option is available on the login screen.
- Privacy Policy: Access to the app's privacy policy is provided for review.
Dynamic Authorization Views — Visits vs. Services: Depending on the organization's configuration and specific service agreement, the FMS app will display authorizations either by Visits (hours or units of direct care) or by Services (monetary budget for therapeutic supplies or other service categories).
The Home Screen
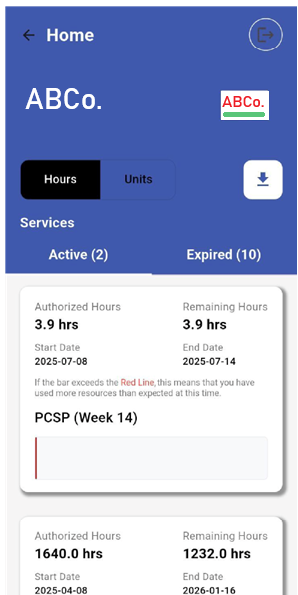
Upon successful login, the Home screen serves as the central dashboard for managing services. At the top, the logo of the registered organization is shown.
Hours vs. Units Toggle
A toggle button on the Home screen switches between "Hours" and "Units." Some organizations track service consumption in hours; others use units. For organizations using units, typically 1 hour equals 4 units (each unit is 15 minutes). (Note: Future updates will provide a choice to see dollars, hours, or units.)
Services are categorized into two sections:
- Active: Services currently ongoing or within their authorized period.
- Expired: Services whose authorization period has concluded.
A download button is available on the main Home page.
This allows selection of a date range to download detailed information about past visits.
Understanding Service Authorization and Consumption
General View
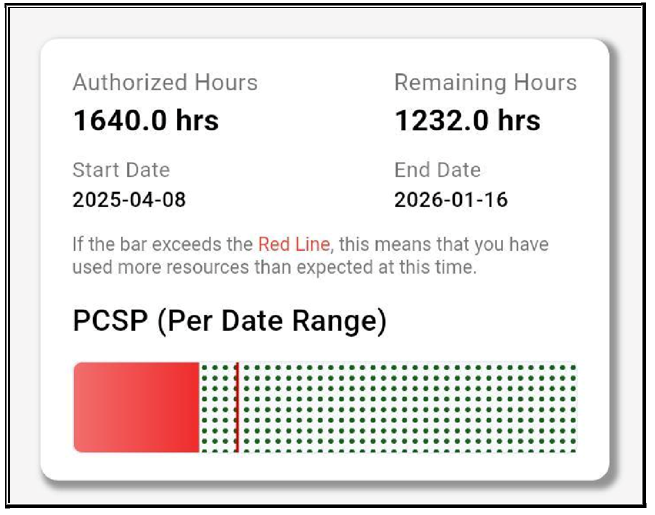
The Home screen visually represents authorized services, whether tracked by hours/units for visits or by monetary budget for services.
- Authorized Hours/Units: Total service time approved for a period.
- Remaining Hours/Units: Service time still available.
- Start Date and End Date: The validity period of the authorization.
Budgeted Authorizations
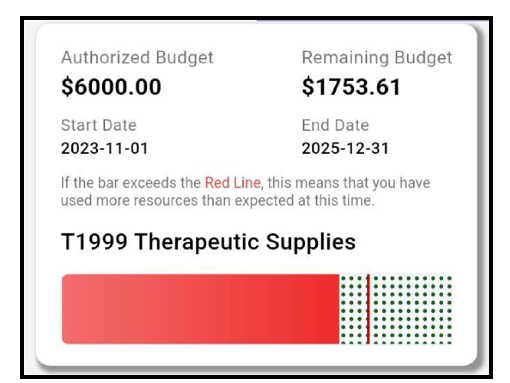
When authorization is based on a budget:
- Authorized Budget: Total monetary amount approved for a specific service category.
- Remaining Budget: Amount still available.
- Start Date and End Date: The budget's validity period.
The Logic Behind the Bars (Red, Green, and Dotted Green Lines)
The bar color provides immediate feedback on consumption relative to authorized limits.
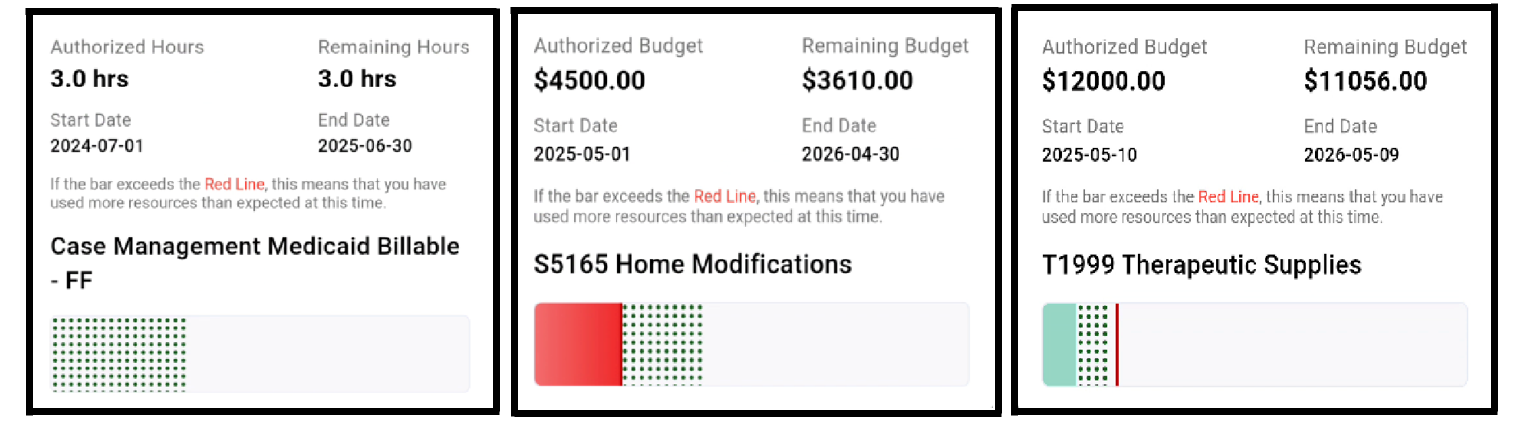
Green Bar — On Track Consumption: The bar appears green if consumed hours/budget are less than or equal to what is technically authorized up to the current date. Example: With a $300 monthly budget ($10 per day), on day 7, up to $70 could have been spent. If only $50 has been spent, that is under budget — a green bar.
Red Bar — Exceeding Expected Consumption: The bar turns red if more resources have been used than expected at that point in the authorization period. This is a visual alert for potential over-utilization.
Vertical Red Line — Today's Standing: The vertical red line within the bar represents today's standing in relation to the authorization's end date.
Dotted Green Line — Pending Administrator Approval:

The dotted green line indicates visits or budget that have been consumed or added by the client but are still pending administrative approval. Once approved, they are officially incorporated into the green or red area of the bar.
The Visits Page for Authorized Hours
Clicking a service overview from the Home screen opens the Visits page, showing a breakdown of individual caregiver visits.
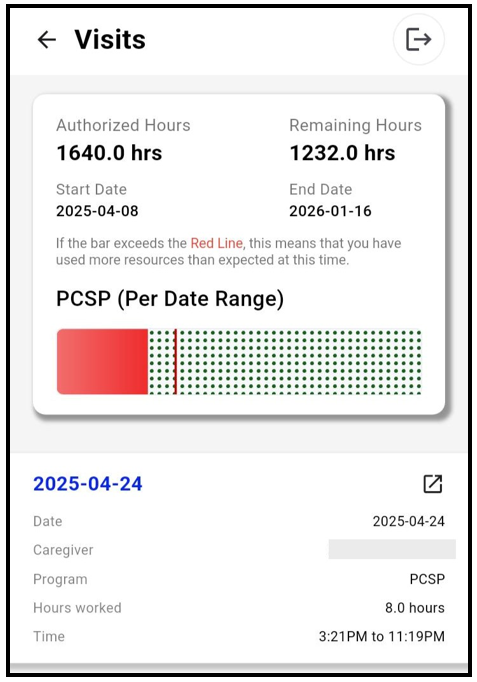
Each visit displays:
- Date: The date the service was provided.
- Caregiver: The name of the caregiver who performed the visit.
- Program: The specific program under which the service was rendered.
- Hours Worked: The duration of the visit.
- Time: The clock-in and clock-out times.
An indicator next to each visit entry
shows the visit can be tapped for more granular details.
Tasks List
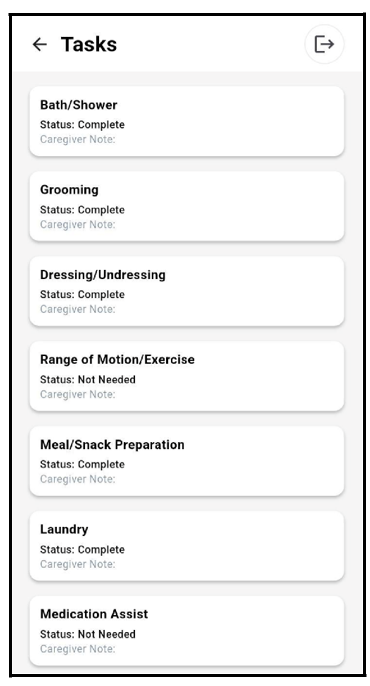
Clicking a visit navigates to the Tasks page, providing a transparent record of the tasks performed during that visit. Each task shows:
- Status: Such as "Complete," "Not Needed," "Refused by Client," or other relevant status.
- Caregiver Note: A field for the service provider to add notes providing context or observations.
The Services Page for Authorized Budgets
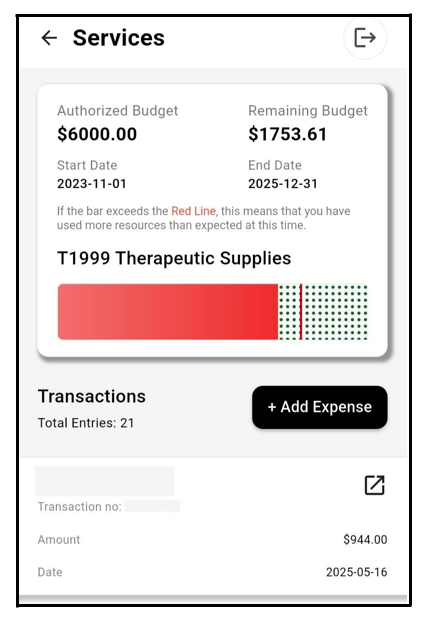
When authorization is for Services, clicking a specific service overview leads to a screen detailing the services.
- Transactions Overview: Summary of all expenses or usages against that service budget.
- Transaction List: Each transaction shows:
- The client's name
- Transaction number (unique identifier)
- Amount (monetary value)
- Date the transaction occurred
Adding a New Expense
A key feature for service-based authorizations is adding new expenses.
"+ Add Expense" Button: Initiates the process of logging a new expense.
Tapping "+ Add Expense" opens a form for expense details:
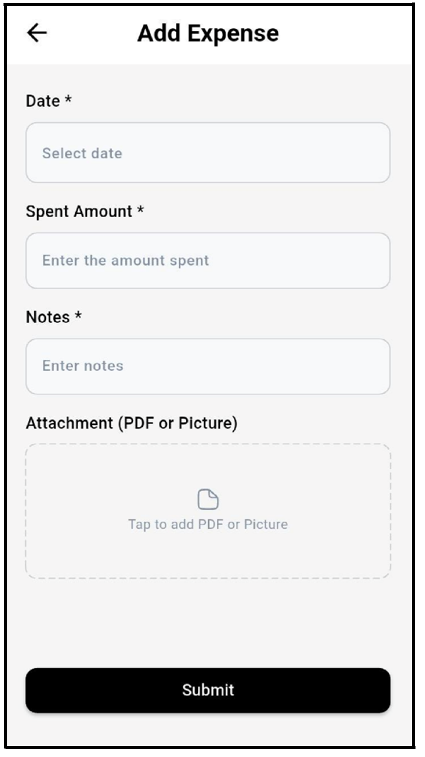
- Date: The date the expense occurred. Required.
- Spent Amount: The monetary value of the expense. Required.
- Notes: Relevant notes or descriptions. Required.
- Attachment (PDF or Picture): Attach supporting documentation such as receipts or invoices.
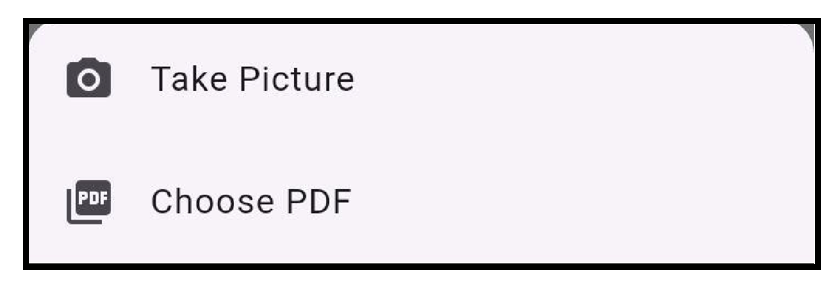
The device's camera can capture an image of the document, or a PDF already saved on the device can be selected.
Once all required information and attachments are entered, tap Submit to record the expense.
Viewing Transaction Details
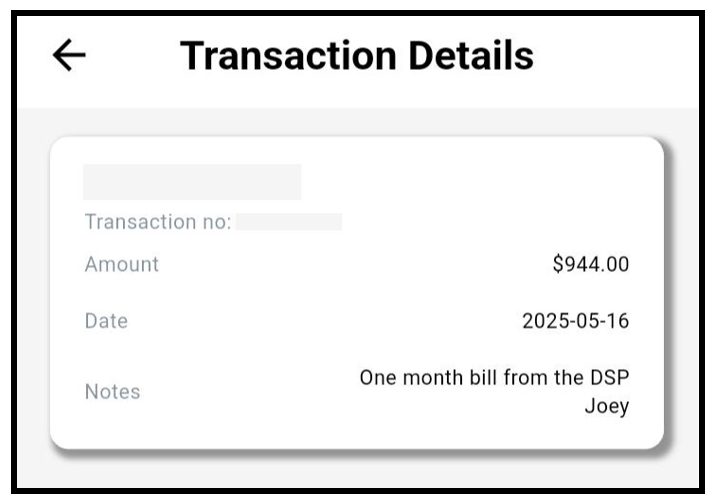
Clicking an entry in the transaction list opens the Transaction Details screen, showing:
- Client's name
- Transaction number
- Amount
- Date
- Any notes added when the expense was submitted
Navigating and Logging Out
Consistent navigation elements throughout the app:
- Back Button: A left arrow icon at the top left of each screen navigates to the previous page.
- Log Out Button: Located at the top right of the screen,
provides a quick and secure way to log out.
The app automatically logs the user out after 10 minutes of inactivity.
Understanding the Big Picture of Self-Direction
The self-direction model empowers participants to choose and manage their own caregivers, often including friends or family. Ankota's FMS software supports this model by handling the complex administrative and financial tasks, allowing focus on the flexibility of services.