The Business Intelligence Dashboard
Overview
The Business Intelligence Dashboard integrates Ankota with Google Analytics to break down a company's numbers in a transparent way. These dashboards are available under the Reporting section in the Business Intelligence subsection.
To view these boards, a user must:
- Have permissions to view the Reporting section of Ankota.
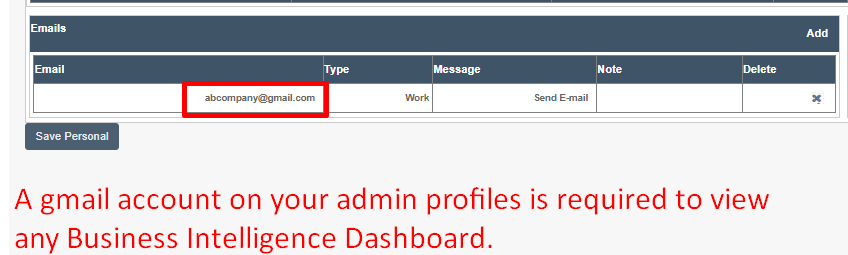
- In the same browser as Ankota, be logged into the Gmail account associated with their registered personal administrative profile in another tab.
All Business Intelligence Dashboards (BIDs) require a registered Gmail login. The newest dashboards are in the process of being rolled out to all customers. If a user is logged into the Gmail account and still cannot see a dashboard, Support should be notified so that the Gmail account can be registered.
Caregiver Compliance
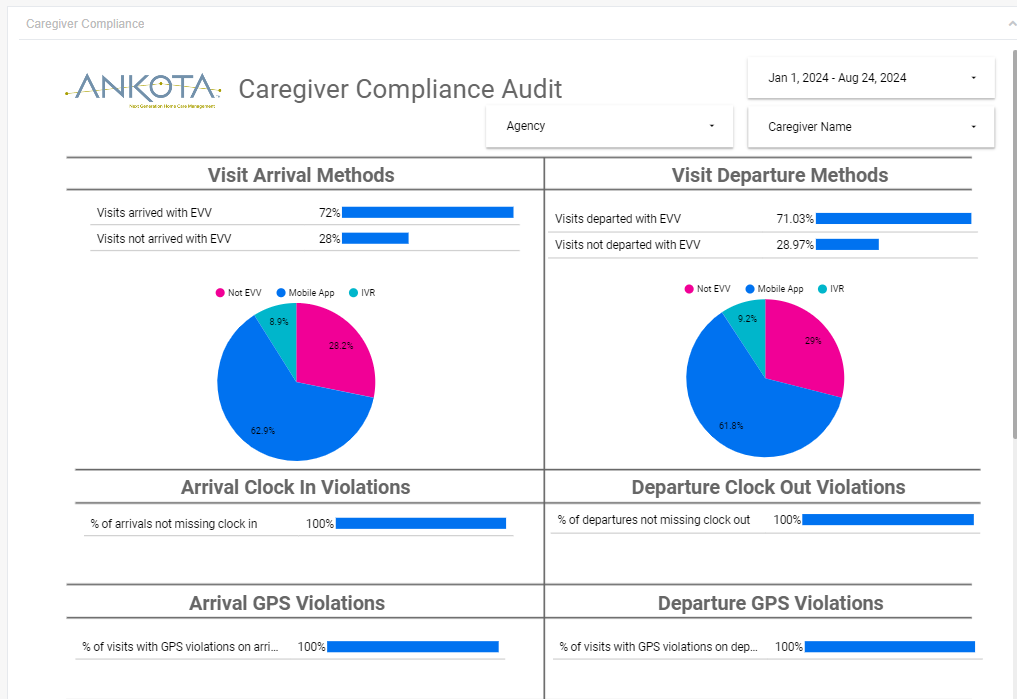
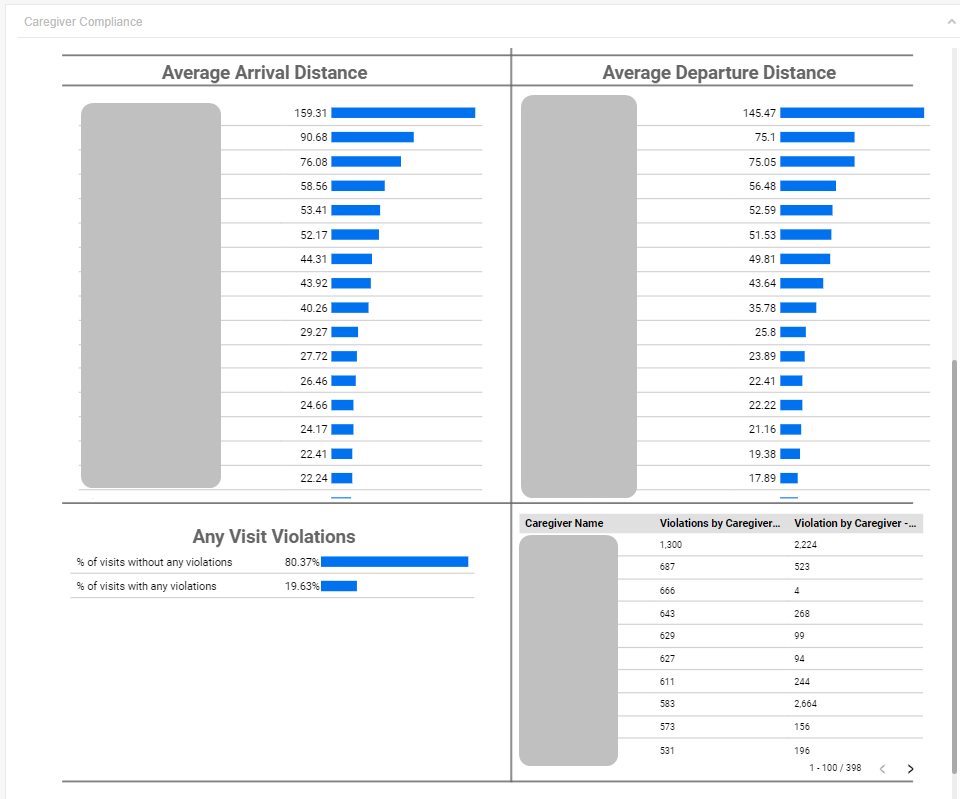
The Caregiver Compliance board provides a detailed breakdown of arrival EVV, departure EVV, missed clock-ins and clock-outs, GPS violations, average GPS distance, visits without errors, and caregiver violations. This provides insight into staff behavior and adherence to EVV protocol.
Business Execution
The Business Execution board breaks down hours management — what is scheduled, paid, and billed. This is a way to share general hours and status without exposing internal financial data. No dollar amounts are shown.
Finance
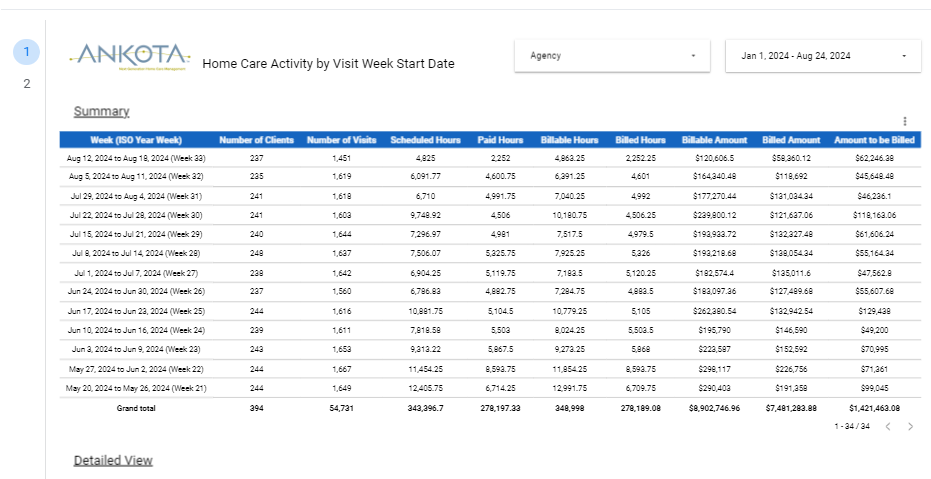
The Finance board is a company overview: it breaks down clients, visits, hours, and billed amounts (billed hours, billable hours, billed amount, and remaining amount to be billed).
Revenue
The Revenue board summarizes potential financial intake.
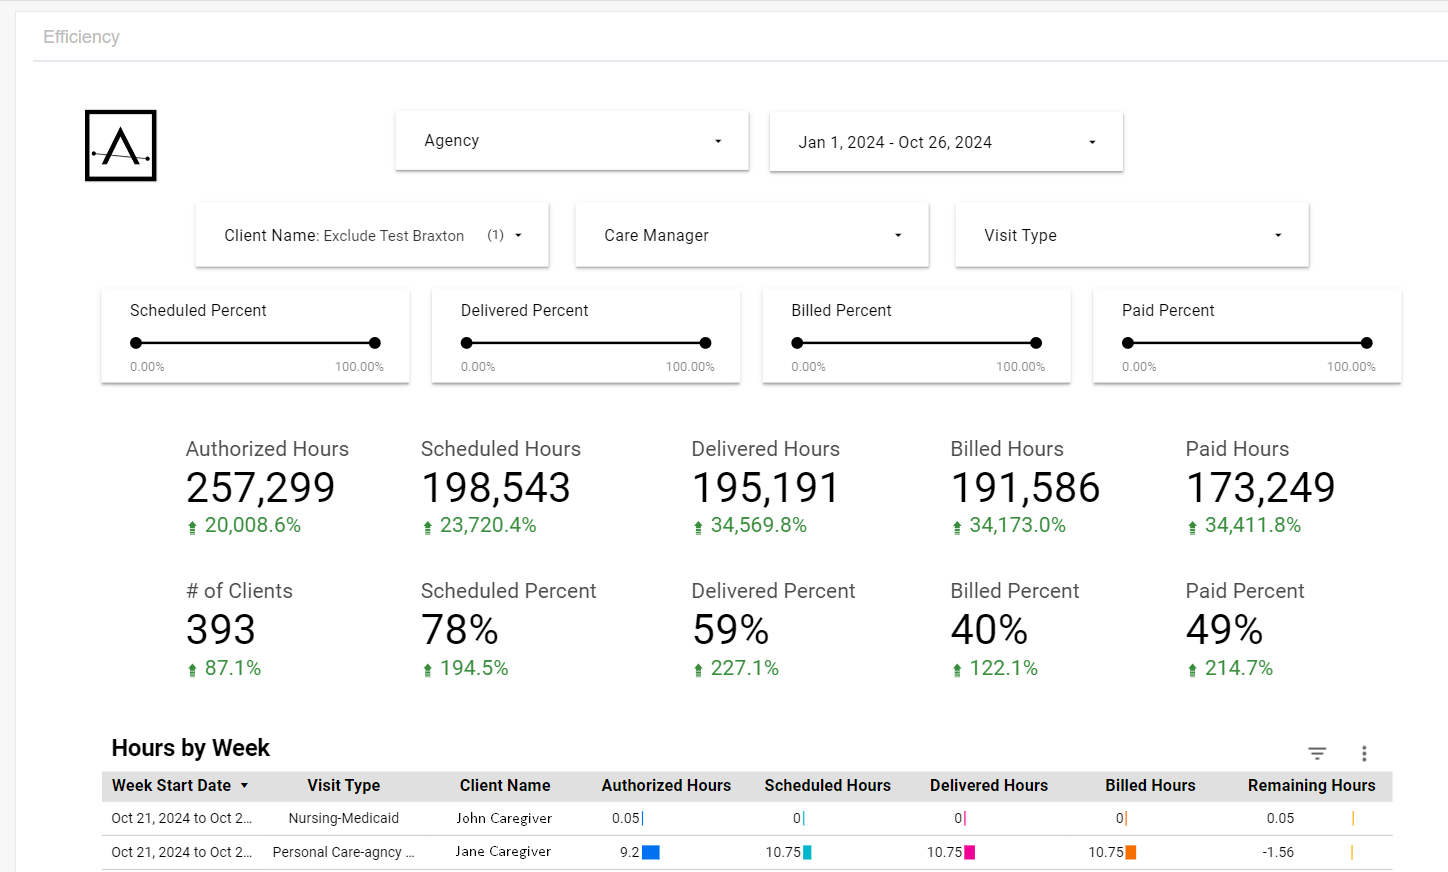
Efficiency
The Efficiency board is an extended Authorized vs. Delivered report.