The Dashboard
Overview
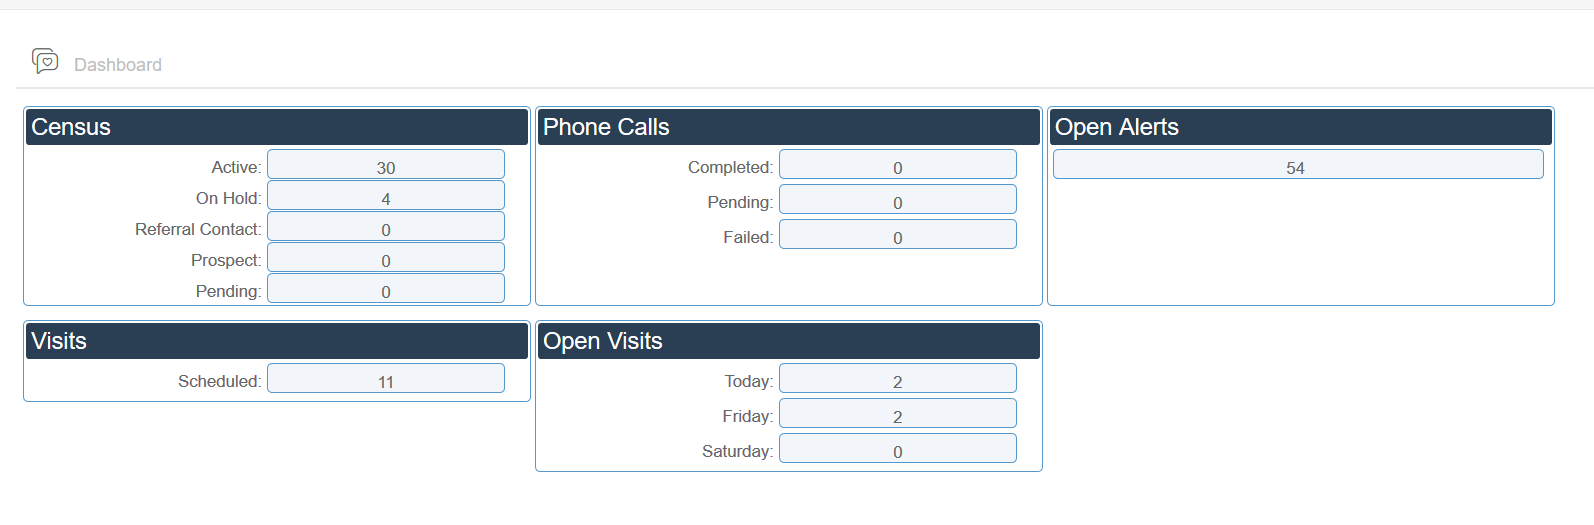
When you first log in to Ankota, you will be presented with the Main Menu in the left-hand column. At the top of the Main Menu is the Dashboard. This screen gives you a quick-glance macro overview of your scheduling processes.
The following data is provided:
- Census: a summary of your clients, in all their statuses.
- Phone calls: your completed, pending, and failed Foresight Care calls. (If you are not using Foresight Care, this does not apply.)
- Open Alerts: unreviewed ("open") alerts.
- Visits: closed and scheduled visits today.
- Open visits: unassigned visits in the next few days.
This is a particularly useful morning review for schedulers.
Was this article helpful?